We’ve enhanced our team performance reports! Now, instead of just average metrics, you’ll see the complete picture with detailed percentiles. Percentiles offer a clearer, more accurate view, helping you identify where your team excels and where there’s room for improvement, without relying solely on average response times.
What are Percentiles?
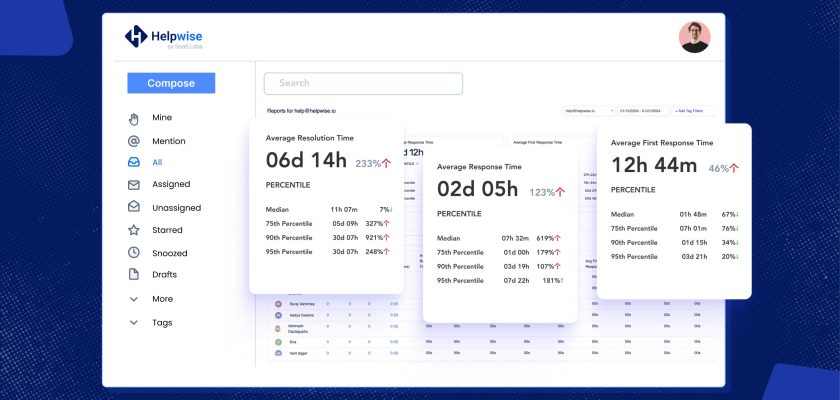
In our revised workflow, we’ve introduced something cool: the 50th percentile (that’s the median) for Average Resolution Time, Average Response Time, and Average First Response Time. Plus, you’ll also see the 75th, 90th, and 95th percentiles. It’s a way more detailed look at how your team’s really doing. For instance, a 90th percentile score of 6 hours means 90% of conversations are resolved in 6 hours or less, with the rest taking more time.

Additionally, you can personalize the team performance table in the reports by including these metrics, allowing you to have an understanding at a team member level.

Other Key Metrics in Team Performance Reports:
- Average Response Time: The average time taken by agent’s to respond to a customer’s inquiry.
- Average Resolution Time: The average time taken to fully resolve a customer’s issue or ticket.
- Average First Response Time: The average time it takes to provide the first response to a customer’s inquiry.
- Customer Satisfaction (CSAT): Helpwise allows you to send a CSAT survey to your customers, enabling you to gather their feedback. For detailed guidance on setting up CSAT, please refer to the provided help document here.
To wrap it up, these new revisions in our reports are all about making your life easier. Understanding your team’s performance is key to making smart, data-driven choices. So, go ahead and give it a try – lead your team to success with confidence!
Also, if you want to explore our platform, you can always book a personalised demo call with our team using the link mentioned here. We’re here to help you make the most of it!